Damstra Insights


Damstra Insights v23.3 release


Dashboard tagging

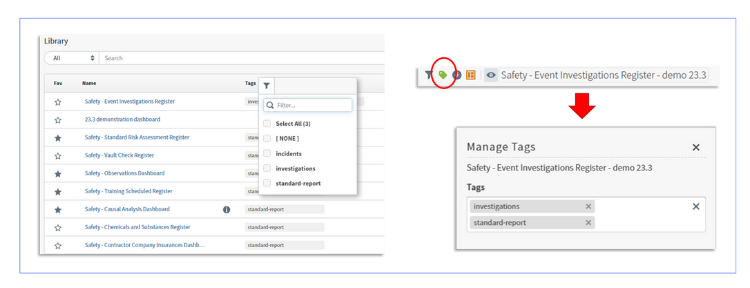
Take control of your content like never before with the ability to effortlessly curate themed groups using our advanced dashboard and source tagging features. Revolutionise your discovery experience by easily filtering dashboards based on specific tags, ensuring you find exactly what you need, precisely when you need it. 


Improvements to map visualisations

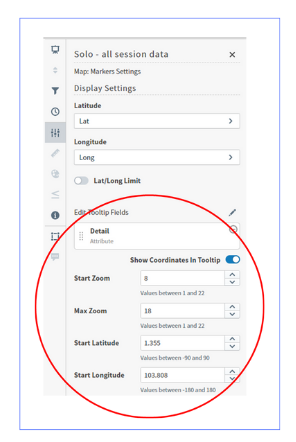
Discover the latest enhancements in our mapping visualizations! With the new update, you have full control over your map visuals. Set your preferred Start Zoom and Max Zoom settings effortlessly to tailor your viewing experience.

  • Define settings for all map visuals for Start Zoom and Max Zoom.
  • Marker coordinates are now shown by default as a tooltip when a user hovers over a marker point. Disable Show Coordinates In Tooltip in the Settings sidebar menu to hide the coordinates on hover.
  • County and Zip fields for US Maps are no longer a required field. You can hide these values by selecting None for these fields in the Settings sidebar menu.
  • Expanded the Country name formats accepted by Map: World Countries visuals to support the ISO-3166 standard.
  • Initial map centre definition can now include Start Latitude and Start Longitude coordinates. When used in combination with the Start Zoom setting, it’s easier than ever to define a specific initial view for map visuals


Additional filter snippet options

  • With our additional filter snippet options, you now have access to advanced operator options, including 'Contains' and 'Does Not Contain.' This empowers you with unparalleled flexibility in filtering your data.
  • If you opt to utilise your value as the display, you can easily do so by toggling the 'Use Value Column as Display Column toggle.
  • Seamlessly link numerous widgets sourced from the same origin effortlessly.
  • Choose a Widget Name and Field, then utilise the Copy icon to duplicate an entry using the same widget and field. Proceed to select additional fields as required.
  • Continue this process until all desired fields have been incorporated.


Arc gauge enhancement

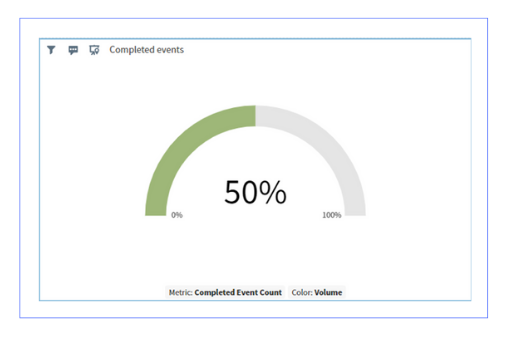
Elevate Your Visuals with Rounded Percentage Numbers in Arc Gauge Display. With our latest update, presenting accurate data has never been easier. Showcase your percentages with clarity and sophistication, rounded to the nearest whole number, for a polished and professional look.


Mobile-friendly user interface updates

  • Mobile users can now easily access a visual's Context menu and tooltip by simply touching or long-touching the visual.
  • Configurable touch and long-touch event behaviors are now available for embedded dashboards.
  • Enjoy full access to all Visual settings on your mobile devices for seamless control and customisation.

Releases and user guide