Damstra Insights


Safety - Return to Work Dashboards


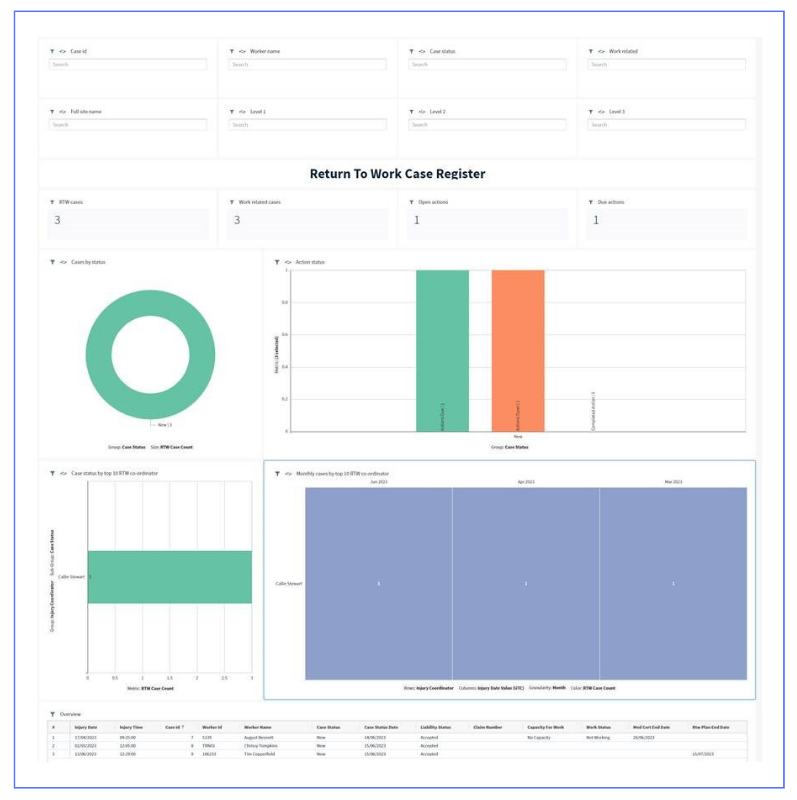
1. Safety – RTW Case Register

Provides an overview of an organisation’s Return to Work cases.

  • View cases by status
  • Quickly identify open and due actions
  • Identify top 10 RTW resource coordinators and their case load
  • With operational filters, you can effortlessly analyse cases by ID, worker name, case status, work-related, and site levels.


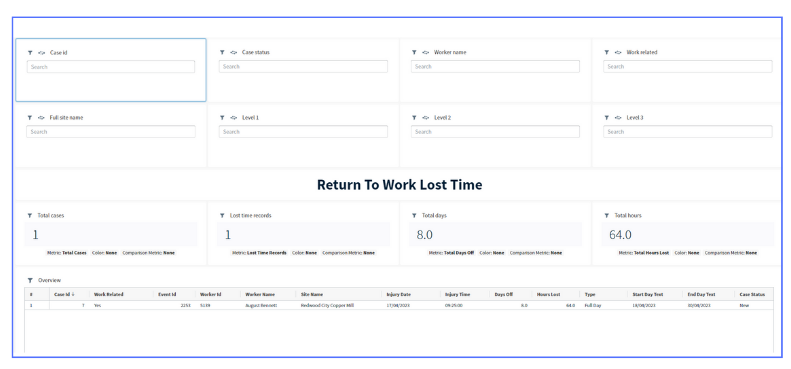
2. Safety – RTW Lost Time Register

    Focuses on RTW Cases that have incurred lost time.

    • High level KPI stats on case numbers, total days and total hours lost
    • View details of lost time return to work cases
    • With operational filters, you can effortlessly analyse cases by ID, worker name, case status, work-related, and site levels.


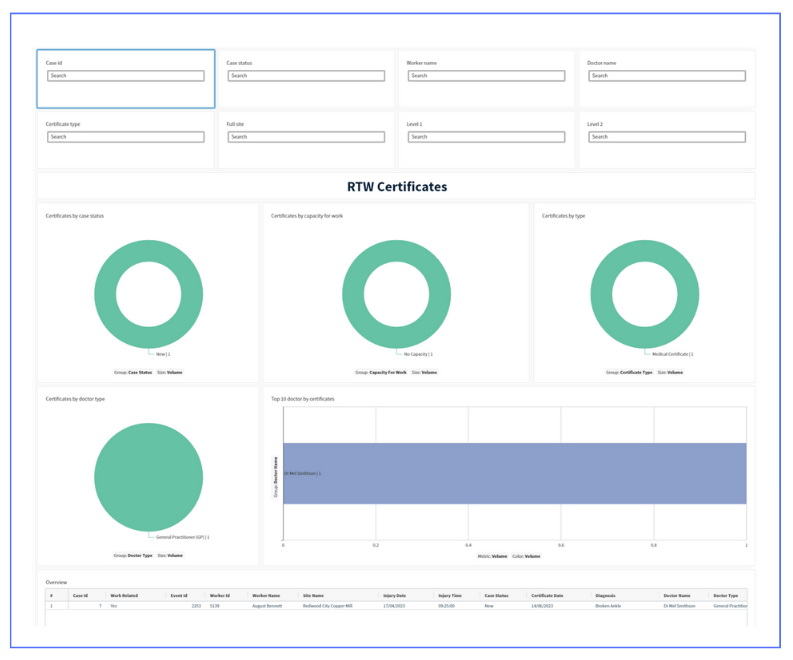
    3. Safety – RTW Certificates

    Breakdown certificates information associated with Return to Work cases, highlighting certificate types (ie. medical), types of medical professional consulted and practitioner details.

    • Identify cases by status, certificates by capacity for work, and certificates by type
    • Visualises practitioner type and cases by doctor
    • View details of certificate and doctor
    • With operational filters, you can effortlessly analyse cases by ID, worker name, case status, doctor, and site levels.


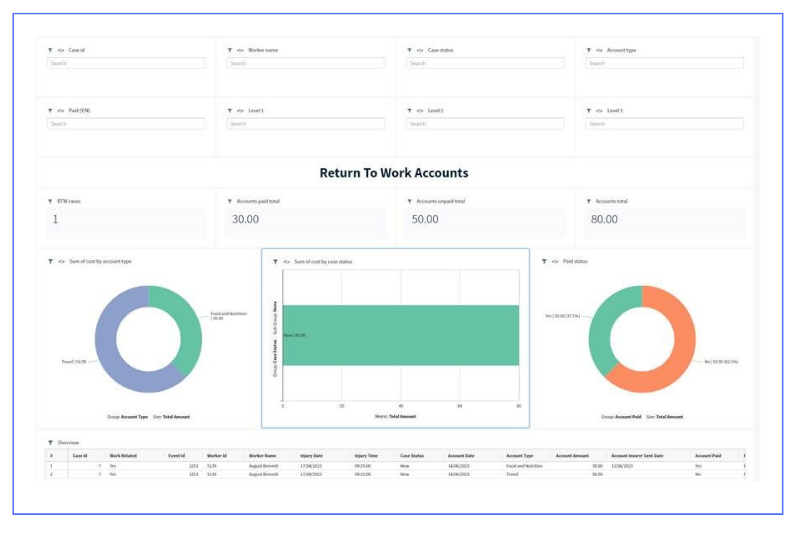
    4. Safety – RTW Accounts

    Shows financials associated with Return to Work cases, highlighting payments and outstanding amounts.

    • Quick KPI stats on accounts paid and unpaid
    • Visualises costs by account type, case and payment status’
    • View details of RTW accounts
    • With operational filters, you can effortlessly analyse cases by ID, worker name, case status, account type, and site levels.


    Safety - Vault Check Inspection Responses

    Our previous Vault Check dashboard provided some very high-level statistics, but was restrictive and did not allow customers to dive into the data.

    While the new dashboard provides access to the raw inspection responses, but also provides additional analysis:

    1. Filter inspection data to a particular site. Target a specific inspection by name, template type and name, status or user. 

    2. KPI totals quickly show inspection and templates totals, while also showing the tally of Yes, No, NA and incomplete responses


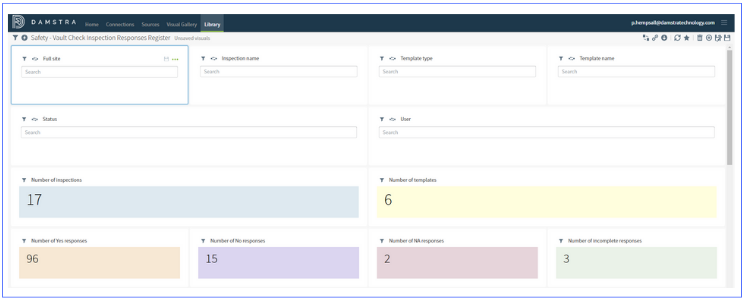
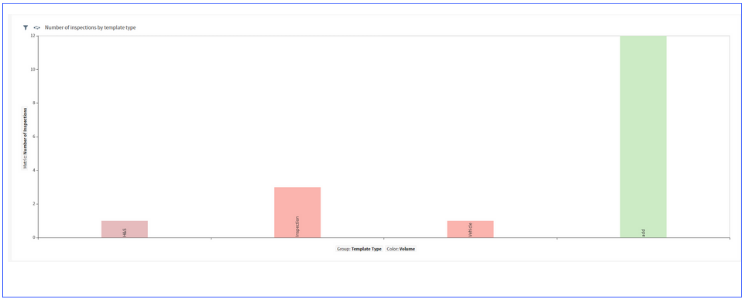
    3. Breakdown of inspections by template type


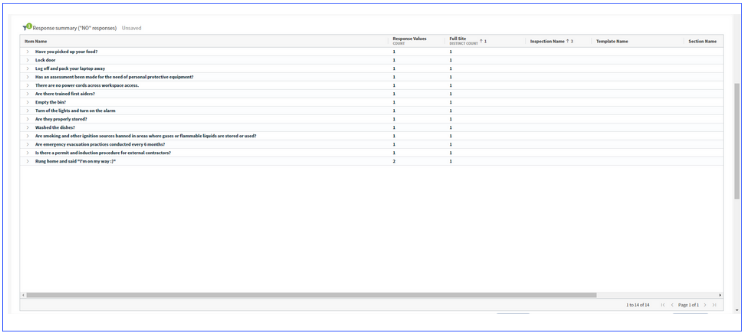
      4. Identify non-compliances with ease using the “no” response pivot table


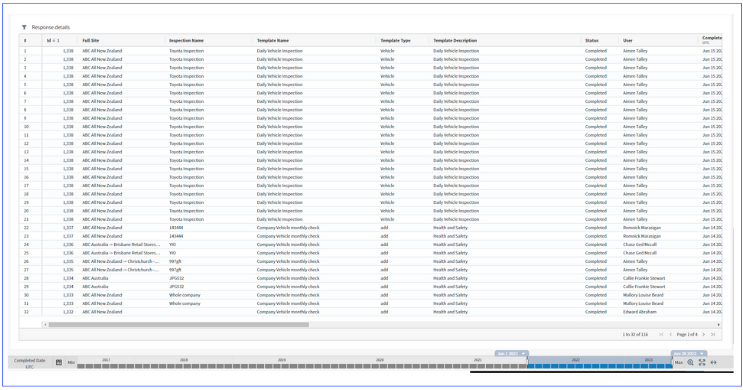
        5. Analyse the raw vault check inspection responses using the table at the end of the dashboard


          Safety - Performance Indicator Dashboard

          Now available as a standard report for all Safety clients from within Insights. 
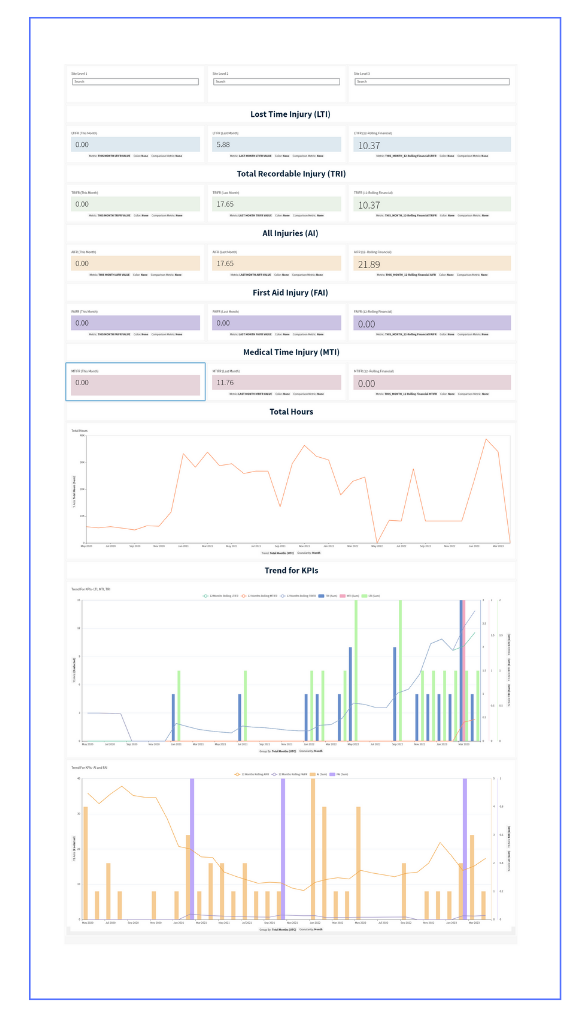
          KPIs includes:

          • Current month
          • Last month and 
          • Financial year frequency rates in an easy-to-consume dashboard for:
            • Lost Time Injuries
            • Total Recordable Injuries
            • All Injuries, First Aid Injuries
            • Medical Time Injuries (MTI) 

          Damstra Insights Upgrade to V23.1

          Damstra Insights V23.1 is more than an upgrade; it's a gateway to a world of endless possibilities. We unveil an exceptional range of new features and optimisations, and additional training material and videos will be published post-deployment.

          Releases and user guide