
1. Log into the EPP. Filter to client and/or worksite.

2. Ensure the user has a linked profile.

3. Open worker’s profile > add worksite skill “View Report” (DMS250). If they have access to multiple worksite – choose an “active” mobilisation.

We've upgraded responsive dashboard layouts to ensure smoother and easier management.
1. Converted dashboard widgets are now presented in the responsive layout format in the same row and columnar layouts as in their previous configuration.

2. By setting minimum widget height and width settings, you can define the appropriate values for widgets' sizes on your dashboard. You can also adjust the position and padding of content in widgets.

3. Drag and drop zones for moving widgets are easier.
1. You can now export dashboards in Excel (.xlsx) format.

2. Information for each widget appears in its own named tab, with data provided as visual data or raw data for the visuals.

1. Scheduled dashboard reports can now be sent in Excel (.xlsx) format, providing regular updates in the timeframe and frequency you define.
2. Create or update a scheduled dashboard report to use Excel format as needed.

Users can set up conditional formatting for their KPI visuals, enabling them to control the display of labels, backgrounds, and arrow appearances.
1. Colour Settings have been expanded into Colour Rules you can modify to suit your data presentation for new and existing visuals.

2. A default color palette and rules are applied to KPI visuals; select and edit any rule in the color sidebar menu to modify. Optimise the contrast of text against the background and apply expanded and conditional formatting options such as bold and italics.

Experience enhanced wrapping functions that intelligently wrap cell text between words, prioritising seamless adjustments to column widths without splitting words.
1. Wrap the cell content by clicking the column’s content menu “…”

2. Choose “Wrap cell value”.

The extended capabilities of filter snippets accelerate your access to accurate data, enhancing your efficiency.
1. Connect multiple filter snippets together to more flexibly filter your visual data.
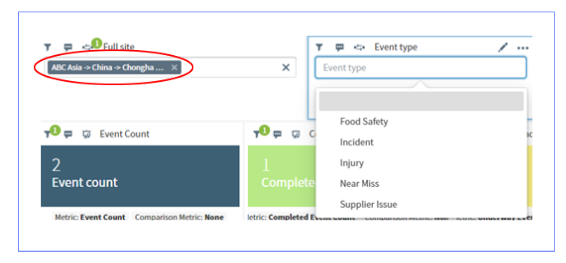
2. The selected values for each filter snippet are saved when you save your dashboard.

3. Create filter snippets that are based on the Time field; connect to visual or snippets to filter data.

Explore a new feature that allows easy searching within individual workspaces for descriptions associated with dashboards, data sources, and visual gallery visuals.
1. Any dashboard, data source, or visual gallery visual with a description is indicated by an info icon () in the table of available items.
2. Provide descriptions for your dashboards to improve findability in the Library.

Gain a comprehensive view of your operations with Damstra Insights, allowing customized centralized reporting across the EPP. Make well-informed business decisions that prioritise safety for your people, assets, and worksites.
The Damstra Insights v23.2 provides customers with new features and an improved user experience, including but not limited to: